Energy in LaosEnergy in Laos
ラオス概観 Laos at a Glance
ラオスの基本情報 Brief Information

- Population
- 7.03 million*
- GDP per capita
- 1,787 USD (current prices)*
- GDP growth rate
- 7.3 %*
*: 2015 values estimated by IMF, Source: International Monetary Fund, World Economic Outlook Database, October 2016
ラオスの行政区分 Provinces of Lao PDR
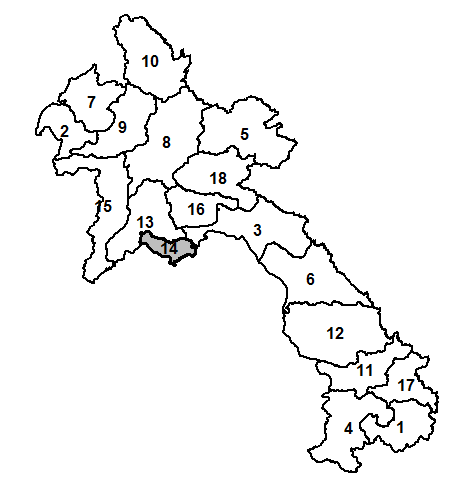
1. Attapeu, 2. Bokeo, 3. Borikhamxay, 4. Champasack, 5. Huaphanh, 6. Khammuane, 7. Luangnamtha, 8. Luangprabang, 9. Oudomxay, 10. Phongsaly, 11. Saravan, 12. Savannakhet, 13. Vientiane Province, 14. Vientiane Capital, 15. Xayaboury, 16. Xaisomboun, 17. Sekong, 18. Xiengkhuang
ラオスについてより詳しく知るための本
- 『ラオス史』(マーチン スチュアート‐フォックス Martin Stuart‐Fox,めこん,2010年11月)
- 『ラオス―インドシナ緩衝国家の肖像』 (青山利勝,中公新書,1995年5月)
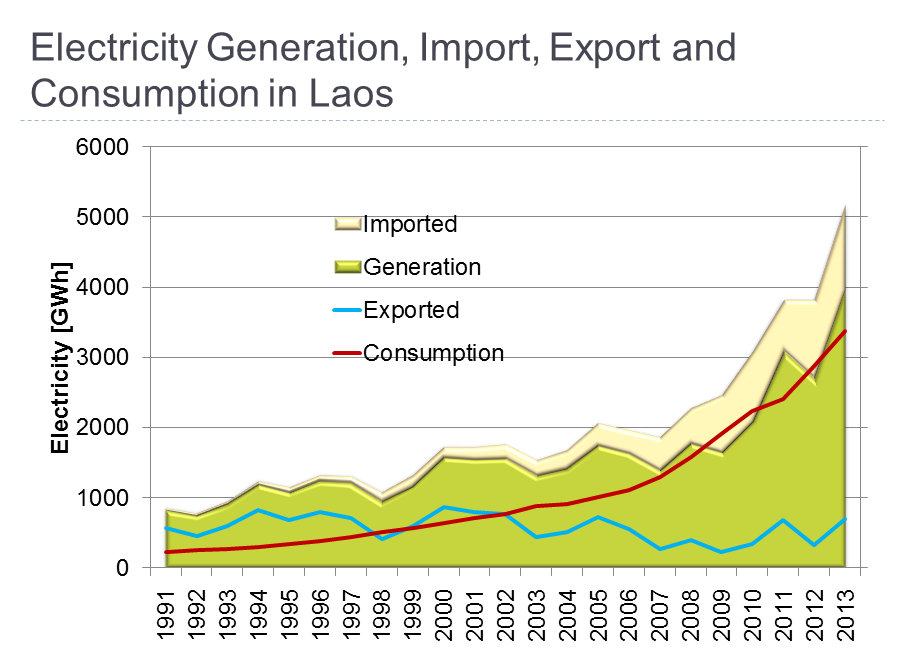
電力生産量,輸入量,輸出量,消費量 Electricity Generation, Import, Exporty, and Consumption
ラオスはメコン川の豊かな水量を利用した水力発電が盛んであり,周辺国に電力を輸出している。「インドシナのバッテリー」と呼ばれている。近年は国内需要が増加しており,生産量と消費量の差がなくなってきている。そのため,輸出に回せる電力が減っているとともに,輸入量も増加している。
| Year | Generation | Imported | Exported | Consumption |
|---|---|---|---|---|
| 1991 | 834.6 | 34.9 | 562.6 | 220.7 |
| 1992 | 751.8 | 41.3 | 459.8 | 252.7 |
| 1993 | 919.6 | 47.7 | 595.8 | 264.3 |
| 1994 | 1198.3 | 57.5 | 829.3 | 303.4 |
| 1995 | 1085.0 | 76.8 | 675.6 | 337.5 |
| 1996 | 1247.8 | 87.6 | 792.4 | 379.5 |
| 1997 | 1218.7 | 101.7 | 710.2 | 433.9 |
| 1998 | 947.8 | 142.3 | 405.2 | 513.3 |
| 1999 | 1168.9 | 172.2 | 598.1 | 565.6 |
| 2000 | 1578.6 | 159.9 | 862.9 | 639.9 |
| 2001 | 1553.7 | 182.5 | 796.4 | 710.3 |
| 2002 | 1570.2 | 200.8 | 771.4 | 766.7 |
| 2003 | 1316.8 | 229.3 | 434.7 | 883.7 |
| 2004 | 1416.5 | 277.6 | 507.1 | 902.8 |
| 2005 | 1751.1 | 325.6 | 727.8 | 1011.1 |
| 2006 | 1639.3 | 334.6 | 547.1 | 1112.4 |
| 2007 | 1398.4 | 475.9 | 268.0 | 1298.4 |
| 2008 | 1777.6 | 510.0 | 391.8 | 1577.9 |
| 2009 | 1655.9 | 818.6 | 229.5 | 1901.3 |
| 2010 | 2096.6 | 999.0 | 341.3 | 2228.2 |
| 2011 | 3081.5 | 747.9 | 678.3 | 2399.4 |
| 2012 | 2698.8 | 1127.3 | 320.4 | 2874.2 |
| 2013 | 3977.0 | 1205.1 | 690.8 | 3381.0 |
| 2014 | 3886.3 | 1486.5 | 444.6 | 3791.3 |
Unit: [GWh / Year]
Source: Electricite Du Laos (EDL), Electricity Statistics 2014
エネルギー消費量 Energy Consumption
石炭・石油・ガス・バイオマス・電力といったすべての種類のエネルギーの消費量に関する包括的なデータとしてInternational Energy Agency(IEA)の"Statistics" [1]ならびにUnited Nations Statistics Division(UNSD, 国連統計部)の"Environment and Energy Statistics" [2]などが公表されている。ただし,IEAはラオスの情報をカバーしていない。そこで,ここではUNSDが公表している近年のエネルギー消費量のみを示す。
Definition:
(Buildings) = (Residential) + (Commercial and public services),
(Total final consumption) = (Buildings) + (Industry) + (Transport) + (Other)
Source:
[1] IEA: Statistics, http://www.iea.org/statistics/statisticssearch/
[2] UNSD: Energy Balances 2014, United Nations, 2017.
国連統計値 (2014)
| Sector | Coal | Oil products | Natural gas | Biofuels and waste | Electricity | Total |
|---|---|---|---|---|---|---|
| Buildings | 0 | 2063 | 0 | 52638 | 5126 | 59827 |
| Residential | 0 | 2063 | 0 | 52638 | 5126 | 59827 |
| Commercial and public services | 0 | 0 | 0 | 0 | 0 | 0 |
| Industory | 571 | 497 | 0 | 0 | 5630 | 6698 |
| Transport | 0 | 2917 | 0 | 0 | 0 | 2917 |
| Other | 0 | 0 | 0 | 0 | 2808 | 2808 |
| Total final consumption | 571 | 5477 | 0 | 52638 | 13564 | 72250 |
Unit : [TJ]
国連統計値 (2012)
| Sector | Coal | Oil products | Natural gas | Biofuels and waste | Electricity | Total |
|---|---|---|---|---|---|---|
| Buildings | 0 | 1978 | 0 | 52895 | 3615 | 58488 |
| Residential | 0 | 1978 | 0 | 52895 | 3615 | 58488 |
| Commercial and public services | 0 | 0 | 0 | 0 | 0 | 0 |
| Industry | 7505 | 446 | 0 | 0 | 2103 | 10054 |
| Transport | 0 | 3172 | 0 | 0 | 0 | 3172 |
| Other | 0 | 0 | 0 | 0 | 2920 | 2920 |
| Total final consumption | 7505 | 5596 | 0 | 52895 | 8638 | 74634 |
Unit : [TJ]
家庭部門のエネルギー消費量の推移 Residential Energy Consumption
Total Residential Energy Consumption* [TJ / annum ( = year) ] and Population**
| Year | Coal | Oil products | Natural gas | Biofuels and waste | Electricity | Population |
|---|---|---|---|---|---|---|
| 1990 | 4247839 | |||||
| 1991 | 4371549 | |||||
| 1992 | 4496971 | |||||
| 1993 | 4621685 | |||||
| 1994 | 4742685 | |||||
| 1995 | 4857774 | |||||
| 1996 | 4966303 | |||||
| 1997 | 5068658 | |||||
| 1998 | 5165072 | |||||
| 1999 | 5256207 | |||||
| 2000 | 1818 | 5342879 | ||||
| 2001 | 2066 | 5424701 | ||||
| 2002 | 2171 | 5502340 | ||||
| 2003 | 2452 | 5579003 | ||||
| 2004 | 2556 | 5658894 | ||||
| 2005 | 2790 | 5745012 | ||||
| 2006 | 3078 | 5838837 | ||||
| 2007 | 3564 | 5939634 | ||||
| 2008 | 4363 | 6045439 | ||||
| 2009 | 5393 | 6153153 | ||||
| 2010 | 6242 | 6260544 | ||||
| 2011 | 0 | 1948 | 0 | 53032 | 3615 | 6347567 |
| 2012 | 0 | 1978 | 0 | 52895 | 3615 | 6444530 |
| 2013 | 0 | 2044 | 0 | 52756 | 4601 | 6541304 |
| 2014 | 0 | 263 | 0 | 52638 | 5126 | 6639756 |
| 2015 | 0 | 268 | 0 | 43852 | 5741 | 6741164 |
| 2016 | 0 | 296 | 0 | 36734 | 6247 | 6845846 |
| 2017 | 0 | 336 | 0 | 36414 | 6743 | 6953035 |
| 2018 | 0 | 339 | 0 | 36044 | 6893 | 7061507 |
Source: *: UNSD: Energy Balances 2014, United Nations, 2017; **: World Bank: World Development Indicators, http://data.worldbank.org/data-catalog/world-development-indicators.
Residential Energy Consumption per capita [MJ / capita /annum]
| Year | Coal | Oil products | Natural gas | Biofuels and waste | Electricity |
|---|---|---|---|---|---|
| 2011 | 0.0 | 306.0 | 0.0 | 8354.7 | 569.5 |
| 2012 | 0.0 | 306.9 | 0.0 | 8207.7 | 560.9 |
| 2013 | 0.0 | 312.5 | 0.0 | 8065.1 | 703.4 |
| 2014 | 0.0 | 39.6 | 0.0 | 6726.3 | 772.0 |
| 2015 | 0.0 | 39.8 | 0.0 | 6505.1 | 851.6 |
| 2016 | 0.0 | 43.2 | 0.0 | 5365.9 | 912.5 |
| 2017 | 0.0 | 48.3 | 0.0 | 5237.1 | 969.8 |
| 2018 | 0.0 | 48.0 | 0.0 | 5104.3 | 976.1 |
バナースペース
福代研究室
〒755-8611
山口県宇部市常盤台2−16−1
FAX 0836-85-9877