Energy in Nepal | ऊर्जा नेपालीEnergy in Nepal ऊर्जा नेपाली
ネパール概観 Nepal at a Glance | नेपाल
ネパールの基本情報 Brief Information

- Population
- 28.98 million*
- GDP per capita
- $ 2,297 (PPP, constant 2011 international $)*
*: 2016 value estimated by the World Bank, World Development Indicators
ネパールの行政区分
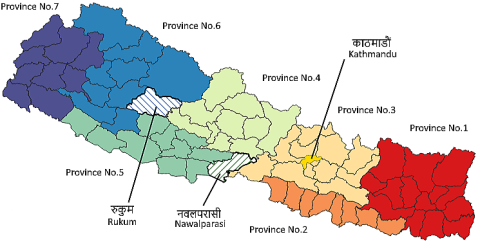
ネパールは2015年憲法に基づき,7つの州(Province, प्रदेशहरू)で構成される連邦となった。ナワルパラーシ郡の東部は第4州に,西部は第5州に所属する。また,ルクム郡の東部は第5州に,西部は第6州に所属する。
ネパールのカースト/民族構成
ネパールは多民族国家であり,Census 2011* によれば,ネパールには125のカースト/民族集団がいる。最大のグループはパールバティ・ヒンドゥーと呼ばれる民族集団の中の上位カースト,チェトリ (Chhetri क्षेत्री)で約17%を占めている。同じくパーリバティ・ヒンドゥーの上位カーストであるバフン (Brahman - Hill ब्राह्मण)が第2位で約12%を占める。
*: Government of Nepal, National Planning Commission Secretariat, Central Bu reau of Statistics, National Populatio n and Housing Census 2011, Kathmandu, Nepal, (November, 2012)
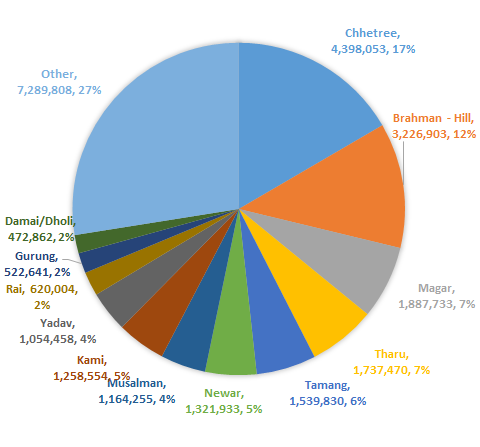
これらに続くのが,シナ・チベット語族のマガール(Magar मगर),印欧語族インド語派のタルー(Tharu थारू),シナ・チベット語族のタマン(Tamang तामाङ),シナ・チベット語族のネワール(Newar नेवार)で,以上を合わせると人口の半数を超える。
首都があるカトマンズ盆地に長らく(3世紀以降)居住していたのがネワール族で,カトマンズ、パタン、バクタプルの歴史的建造物はネワール族によるものである。
ネパールについてより詳しく知るための本
- 日本ネパール協会『ネパールを知るための60章 エリア・スタディーズ
』(明石書店,2000年9月)
- 八木澤高明『ネパールに生きる―揺れる王国の人びと
』(新泉社,2004年12月)
エネルギー消費量 Energy Consumption
石炭・石油・ガス・バイオマス・電力といったすべての種類のエネルギーの消費量に関する包括的なデータとしてInternational Energy Agency(IEA)の"Statistics" [1]ならびにUnited Nations Statistics Division(UNSD, 国連統計部)の"Environment and Energy Statistics" [2]などが公表されている。ここではIEAおよびUNSDが公表している近年のエネルギー消費量を示す。
Definition:
(Buildings) = (Residential) + (Commercial and public services),
(Total final consumption) = (Buildings) + (Industry) + (Transport) + (Other)
Source:
[1] IEA: Statistics, http://www.iea.org/statistics/statisticssearch/
[2] UNSD: Energy Balances 2015, United Nations, 2018.
国連統計値 (2015)
| Sector | Coal | Oil products | Natural gas | Biofuels and waste | Electricity | Total |
|---|---|---|---|---|---|---|
| Buildings | 100 | 10601 | 0 | 395834 | 8903 | 415438 |
| Residential | 100 | 6067 | 0 | 393363 | 7081 | 406611 |
| Commercial and public services | 0 | 4534 | 0 | 2471 | 1822 | 8827 |
| Industory | 23237 | 431 | 0 | 20255 | 4356 | 48279 |
| Transport | 0 | 29240 | 0 | 0 | 22 | 29262 |
| Other | 0 | 4902 | 0 | 0 | 746 | 5648 |
| Total final consumption | 23337 | 45174 | 0 | 416089 | 14027 | 498627 |
Unit : [TJ]
IEA統計値 (2015)
| Sector | Coal | Oil products | Natural gas | Biofuels and waste | Electricity | Total |
|---|---|---|---|---|---|---|
| Buildings | 84 | 11053 | 0 | 395778 | 8918 | 415833 |
| Residential | 84 | 6322 | 0 | 393308 | 7076 | 406789 |
| Commercial and public services | 0 | 4731 | 0 | 2470 | 1842 | 9043 |
| Industory | 23237 | 461 | 0 | 2554 | 4354 | 30606 |
| Transport | 0 | 31192 | 0 | 0 | 42 | 31234 |
| Other | 0 | 5234 | 0 | 0 | 712 | 5945 |
| Total final consumption | 23320 | 47939 | 0 | 398332 | 14026 | 483617 |
Unit : [TJ]
国連統計値 (2012)
| Sector | Coal | Oil products | Natural gas | Biofuels and waste | Electricity | Total |
|---|---|---|---|---|---|---|
| Buildings | 103 | 6138 | 0 | 141052 | 6930 | 154223 |
| Residential | 103 | 6138 | 0 | 141052 | 5314 | 152607 |
| Commercial and public services | 0 | 0 | 0 | 0 | 1616 | 1616 |
| Industry | 18370 | 1192 | 0 | 8742 | 4205 | 32509 |
| Transport | 0 | 30737 | 0 | 0 | 29 | 30766 |
| Other | 0 | 8802 | 0 | 3297 | 500 | 12599 |
| Total final consumption | 18473 | 46869 | 0 | 153091 | 11664 | 230097 |
Unit : [TJ]
IEA統計値 (2012)
| Sector | Coal | Oil products | Natural gas | Biofuels and waste | Electricity | Total |
|---|---|---|---|---|---|---|
| Buildings | 84 | 10634 | 0 | 340387 | 6992 | 358097 |
| Residential | 84 | 6196 | 0 | 338252 | 5359 | 349891 |
| Commercial and public services | 0 | 4438 | 0 | 2135 | 1633 | 8206 |
| Industry | 18003 | 419 | 0 | 2177 | 4103 | 24702 |
| Transport | 0 | 29768 | 0 | 0 | 42 | 29810 |
| Other | 0 | 5024 | 0 | 0 | 544 | 5568 |
| Total final consumption | 18087 | 45845 | 0 | 342564 | 11681 | 418178 |
Unit : [TJ]
家庭部門のエネルギー消費量の推移 Residential Energy Consumption
Total Residential Energy Consumption* [TJ / annum ( = year) ] and Population**
| Year | Coal | Oil products | Natural gas | Biofuels and waste | Electricity | Population |
|---|---|---|---|---|---|---|
| 1990 | 0 | 3140 | 0 | 224706 | 963 | 18749406 |
| 1991 | 0 | 3936 | 0 | 229562 | 1005 | 19245054 |
| 1992 | 0 | 4689 | 0 | 234503 | 963 | 19773772 |
| 1993 | 0 | 5275 | 0 | 239527 | 1005 | 20321175 |
| 1994 | 42 | 5987 | 0 | 244760 | 1089 | 20867130 |
| 1995 | 42 | 6992 | 0 | 250119 | 1214 | 21396384 |
| 1996 | 0 | 8122 | 0 | 255604 | 1298 | 21903379 |
| 1997 | 0 | 9420 | 0 | 261214 | 1382 | 22389803 |
| 1998 | 0 | 9839 | 0 | 266950 | 1507 | 22856305 |
| 1999 | 42 | 11137 | 0 | 272812 | 1717 | 23305994 |
| 2000 | 42 | 10760 | 0 | 288638 | 1926 | 23740911 |
| 2001 | 42 | 13147 | 0 | 296049 | 2135 | 24161777 |
| 2002 | 42 | 11723 | 0 | 306181 | 2261 | 24566342 |
| 2003 | 42 | 12979 | 0 | 313005 | 2428 | 24950623 |
| 2004 | 42 | 10718 | 0 | 319620 | 2805 | 25309449 |
| 2005 | 42 | 10760 | 0 | 326529 | 2973 | 25640287 |
| 2006 | 42 | 8750 | 0 | 333227 | 3308 | 25940618 |
| 2007 | 42 | 7453 | 0 | 340136 | 3475 | 26214847 |
| 2008 | 42 | 5317 | 0 | 347463 | 3391 | 26475859 |
| 2009 | 42 | 5568 | 0 | 351398 | 4145 | 26741103 |
| 2010 | 42 | 5820 | 0 | 354748 | 4354 | 27023137 |
| 2011 | 84 | 6155 | 0 | 364587 | 5066 | 27327147 |
| 2012 | 84 | 6196 | 0 | 338252 | 5359 | 27649925 |
| 2013 | 84 | 6531 | 0 | 383134 | 6196 | 27985310 |
| 2014 | 84 | 7285 | 0 | 388158 | 6615 | 28323241 |
| 2015 | 84 | 6322 | 0 | 393308 | 7076 | 28656282 |
| 2016 | 84 | 10300 | 0 | 397202 | 8289.9 | 28982771 |
Source: *: Energy statistics (IEA), **: World Bank: World Development Indicators, http://data.worldbank.org/data-catalog/world-development-indicators
Residential Energy Consumption per capita [MJ / capita /annum]
| Year | Coal | Oil products | Natural gas | Biofuels and waste | Electricity |
|---|---|---|---|---|---|
| 1990 | 0.0 | 167.5 | 0.0 | 11984.7 | 51.4 |
| 1991 | 0.0 | 204.5 | 0.0 | 11928.4 | 52.2 |
| 1992 | 0.0 | 237.1 | 0.0 | 11859.3 | 48.7 |
| 1993 | 0.0 | 259.6 | 0.0 | 11787.1 | 49.5 |
| 1994 | 2.0 | 286.9 | 0.0 | 11729.5 | 52.2 |
| 1995 | 2.0 | 326.8 | 0.0 | 11689.8 | 56.7 |
| 1996 | 0.0 | 370.8 | 0.0 | 11669.6 | 59.3 |
| 1997 | 0.0 | 420.7 | 0.0 | 11666.7 | 61.7 |
| 1998 | 0.0 | 430.5 | 0.0 | 11679.5 | 65.9 |
| 1999 | 1.8 | 477.9 | 0.0 | 11705.7 | 73.7 |
| 2000 | 1.8 | 453.2 | 0.0 | 12157.8 | 81.1 |
| 2001 | 1.7 | 544.1 | 0.0 | 12252.8 | 88.4 |
| 2002 | 1.7 | 477.2 | 0.0 | 12463.4 | 92.0 |
| 2003 | 1.7 | 520.2 | 0.0 | 12545.0 | 97.3 |
| 2004 | 1.7 | 423.5 | 0.0 | 12628.5 | 110.8 |
| 2005 | 1.6 | 419.7 | 0.0 | 12735.0 | 116.0 |
| 2006 | 1.6 | 337.3 | 0.0 | 12845.8 | 127.5 |
| 2007 | 1.6 | 284.3 | 0.0 | 12974.9 | 132.6 |
| 2008 | 1.6 | 200.8 | 0.0 | 13123.8 | 128.1 |
| 2009 | 1.6 | 208.2 | 0.0 | 13140.7 | 155.0 |
| 2010 | 1.6 | 215.4 | 0.0 | 13127.6 | 161.1 |
| 2011 | 3.1 | 225.2 | 0.0 | 13341.6 | 185.4 |
| 2012 | 3.0 | 224.1 | 0.0 | 12233.4 | 193.8 |
| 2013 | 3.0 | 233.4 | 0.0 | 13690.5 | 221.4 |
| 2014 | 3.0 | 257.2 | 0.0 | 13704.6 | 233.6 |
| 2015 | 2.9 | 220.6 | 0.0 | 13725.0 | 246.9 |
| 2016 | 2.9 | 355.4 | 0.0 | 13704.8 | 286.0 |
バナースペース
福代研究室
〒755-8611
山口県宇部市常盤台2−16−1
FAX 0836-85-9877